



Visualize the math problems
Plotica is a free graphing calculator. Plot functions and datasets, take derivatives and integrals, and switch between Cartesian and polar grids — all in your browser.
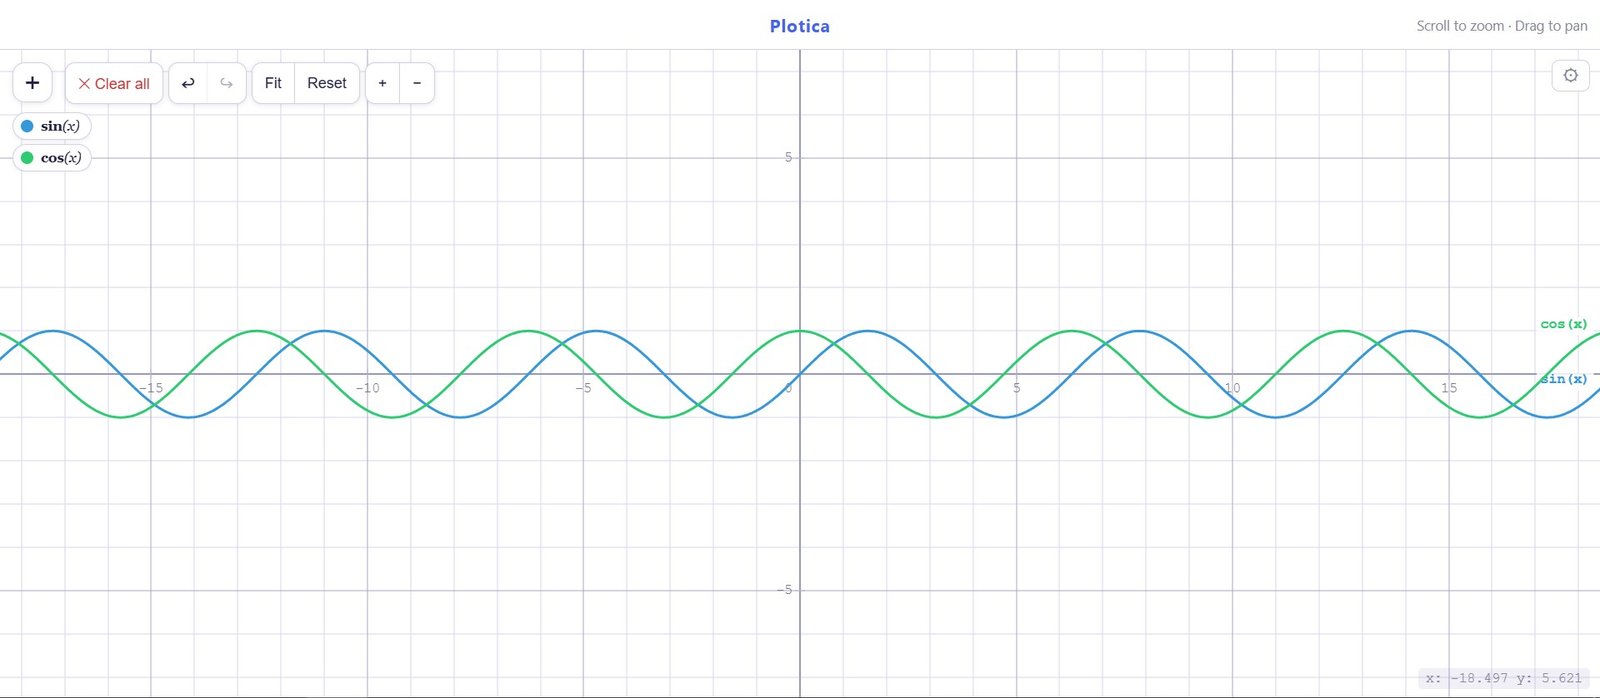
What you can explore
Functions
Plot explicit functions y = f(x) using natural math notation, with a built-in equation editor and on-screen keyboard.
Multiple plots
Graph as many functions and datasets together as you need, each with its own color, line width, and display style.
Datasets
Paste CSV, TSV, or point pairs directly, or drop a .csv or .txt file onto the graph, then switch between scatter, line, or both.
Calculus
Overlay a function's derivative or antiderivative, plot a dataset's cumulative integral, or calculate an exact definite integral between two points.
Polar graphs
Switch to a polar grid and plot curves in terms of θ, with adjustable angle bounds.
Pan & zoom
Drag to pan and scroll to zoom, centered exactly on your cursor — with pinch-to-zoom and drag-to-pan on touch devices too.
Customization
Choose Cartesian, polar, or no grid, adjust tick density and line thickness, and label your axes.
Save & load
Export your graph as a JSON file and load it back later — everything stays on your device.
Undo & redo
Step backward or forward through any change you've made to the graph.
Overview
Plotica is Scinopy's interactive graphing and data-visualization tool, created out of a practical necessity: simulations become far more useful when students can see not only what is happening, but also how the underlying physical quantities change.
It started as a way to graph data generated by Scinopy's other simulations, and has since grown into a standalone graphing environment in its own right. The long-term plan is for Plotica to become a shared visualization engine across the whole platform, where any simulation could call it directly from inside its own interface and feed it live data — drawing and updating graphs in real time as the simulation runs.
Today, Plotica already supports interactive mathematical plotting, multiple functions and datasets, 2D visualization, adjustable viewing controls, and tools for exploring relationships between variables. Its purpose is to connect equations, simulation data, and visual intuition — turning changing numbers into something students can immediately see, explore, and understand.
Controls & supported devices
Plotica runs entirely in the browser — nothing to install.
Mouse: drag to pan, scroll to zoom, and click a plot in the legend to open its panel. Touch: drag with one finger to pan, pinch with two fingers to zoom. Keyboard: undo and redo shortcuts work alongside the on-screen buttons.